Disable TCP offloading on all Interfaces in Linux

We had a customer that was experiencing severe issues with checksum failures and it was causing many retransmissions to occur on the virtual machine.

My colleague was able to come up with a oneliner to disable offloading on all the interfaces.

# for iface in $(cd /sys/class/net; echo *); do ethtool -k $iface | awk -F: '/offload: on$/{print$1}' | sed 's/^\(.\).*-\(.\).*-\(.\).*/\1\2\3/' | xargs --no-run-if-empty -n1 -I{} ethtool -K $iface {} off; done

Nice. Thanks D 😀

Pro actively Securing and Analyzing Login Attacks in WordPress and automating abuse reports

So, noticed there were a lot of failed logins being reported by my security software. So, I thought I’d do some manual digging around as to what is going on my box. Here is what I did.

Scan the physical packets coming in/out of the box

tcpdump -i eth0 | grep -v rackspace | grep -v newrelic | grep -v 212.121.212.121

This above line gave me lots of output. I could see a lot of ip’s were hitting tcp port 80 a lot, and I wondered why. Obviously it was a bruteforce login attack.

When analysing attacks it’s important to consult the webserver logs for all access, if port 80 http is being used as a vector of attack it is therefore important to identify which addresses are hitting sensitive files, such as wp-logon.php , this is what I expect is being targeted, so I will target them a little;

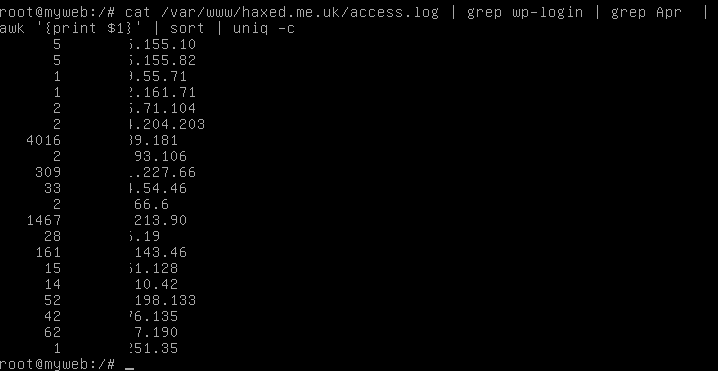
cat /some/path/to/mywebwww/access.log | grep wp-login | grep Apr | awk '{print $1}' | sort | uniq -c

What this does is output the entire webserver access log and only show requests that have wp-login in. Then it removes all entries from Apr, and then it extracts only the IP addresses of those accessing it, and then sorts them uniquely but also -c counting them too, so we know exactly how many access requests have been made to this sensitive wp-logon.php file in just 1 month.
This will allow us to identify the clear attackers and block them.

wp-login

Lets start blocking their access

iptables -I INPUT -s 1.1.1.1 -j DROP

The above line instructs the firewall to block the source ip 1.1.1.1 and DROP all packets coming in on the interface. Simple enough!

What I could do is take the line further, and find out exactly which networks these attacks are coming from by piping the ip addresses to whois. Lets do this now and extract some data we need to start making automated abuse reports with our script;

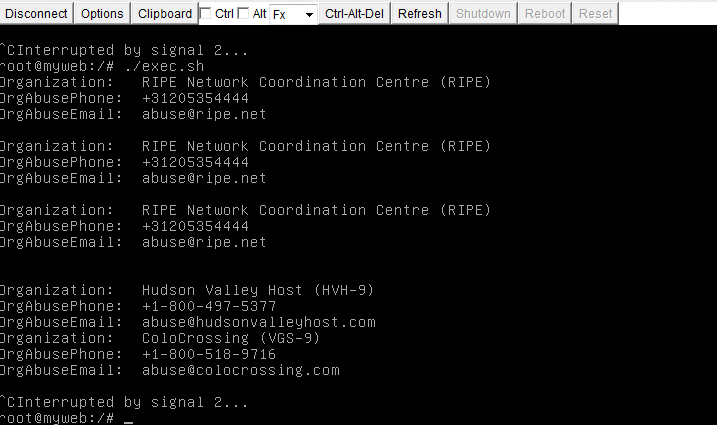
cat /somepath/www/access.log | grep wp-login | grep Apr | awk  '{print $1}' | sort | uniq | xargs -i echo "whois" {} | grep 'Organization\|AbuseEmail\|OrgAbusePhone'; echo;" > exec.sh;

 ./exec.sh

This is what the output looks like
ip-finder

Lets go one step further and refer to the {} output which has the initial IP argument. Then we’ll know which IP to email which abuse contact for when we pipe it to sendmail! ;D

cat /var/logs/access.log | grep wp-login | grep Apr | awk '{print $1}' | sort | uniq | xargs -i echo "echo {}" ";whois" {} "| grep 'OrgAbuseEmail';sleep 3;"

Output looks like

ip-abuse-email-output-automation

Sadly I run out of time with this.. but I will try and get the automatic abuse reporting finished soon 😀ip-abuse-email-output-automation

List Cloud Networks using Rackspace API

In the previous chapter we learnt how to add networks using the API. It’s really simple, its basically a network and label placeholder. But what about viewing the networks we have after we’ve made some? This is pretty simple to confirm.

I have simplified the code a bit to make it easier to read.

#!/bin/sh

USERNAME='mycloudusername'
APIKEY='mycloudapikey'
ACCOUNT_NUMBER=10010101
API_ENDPOINT="https://lon.networks.api.rackspacecloud.com/v2.0/$ACCOUNT_NUMBER"

TOKEN=`curl https://identity.api.rackspacecloud.com/v2.0/tokens -X POST -d '{ "auth":{"RAX-KSKEY:apiKeyCredentials": { "username":"'$USERNAME'", "apiKey": "'$APIKEY'" }} }' -H "Content-type: application/json" |  python -mjson.tool | grep -A5 token | grep id | cut -d '"' -f4`

curl -i -X GET https://lon.networks.api.rackspacecloud.com/v2.0/networks -H "X-Auth-Token: $TOKEN" 

Output

# ./list-networks.sh
  % Total    % Received % Xferd  Average Speed   Time    Time     Time  Current
                                 Dload  Upload   Total   Spent    Left  Speed
100  5143  100  5028  100   115   4472    102  0:00:01  0:00:01 --:--:--  4477
HTTP/1.1 200 OK
Date: Fri, 12 Feb 2016 10:13:49 GMT
Via: 1.1 Repose (Repose/6.2.0.2)
Date: Fri, 12 Feb 2016 10:13:49 GMT
Content-Type: application/json; charset=UTF-8
Content-Length: 336
Server: Jetty(9.2.z-SNAPSHOT)

{"networks": [{"status": "ACTIVE", "subnets": [], "name": "Isolatednet", "admin_state_up": true, "tenant_id": "10010101", "shared": false, "id": "ae36972f-5cba-4327-8bff-15d8b05dc3ee"}], "networks_links": [{"href": "http://localhost:9696/v2.0/networks?marker=ae36972f-5cba-4327-8bff-15d8b05dc3ee&page_reverse=True", "rel": "previous"}]}

Pretty cool, but the format kind of sucks, I forgot to use python |-mjson.tool or jq to format the json output. Lets do that now by adding the line to the end of the curl -i line.

Now the output is nice:

{
    "networks": [
        {
            "admin_state_up": true,
            "id": "ae36972f-5cba-4327-8bff-15d8b05dc3ee",
            "name": "Isolatednet",
            "shared": false,
            "status": "ACTIVE",
            "subnets": [],
            "tenant_id": "10010101"
        }
    ],
    "networks_links": [
        {
            "href": "http://localhost:9696/v2.0/networks?marker=ae36972f-5cba-4327-8bff-15d8b05dc3ee&page_reverse=True",
            "rel": "previous"
        }
    ]
}

The complete code will look like;

#!/bin/sh

USERNAME='mycloudusername'
APIKEY='mycloudapikey'
ACCOUNT_NUMBER=10010101
API_ENDPOINT="https://lon.networks.api.rackspacecloud.com/v2.0/$ACCOUNT_NUMBER"

TOKEN=`curl https://identity.api.rackspacecloud.com/v2.0/tokens -X POST -d '{ "auth":{"RAX-KSKEY:apiKeyCredentials": { "username":"'$USERNAME'", "apiKey": "'$APIKEY'" }} }' -H "Content-type: application/json" |  python -mjson.tool | grep -A5 token | grep id | cut -d '"' -f4`

# with header no formatting
#curl -i -X GET https://lon.networks.api.rackspacecloud.com/v2.0/networks -H "X-Auth-Token: $TOKEN"
# without header with formatting
curl -X GET https://lon.networks.api.rackspacecloud.com/v2.0/networks -H "X-Auth-Token: $TOKEN" | python -mjson.tool

Creating Isolated Cloud Networks thru API in Rackspace Cloud

Hey! So, today I was playing around with Cloud Networking API and thought I would document the basic process of creating a network. It’s simple enough and follows the precise same logic as many of my other tutorials on cloud files, load balancers and etc.

#!/bin/bash

USERNAME='mycloudusername'
APIKEY='mycloudapikey'
ACCOUNT_NUMBER=10010101
API_ENDPOINT="https://lon.networks.api.rackspacecloud.com/v2.0/"

TOKEN=`curl https://identity.api.rackspacecloud.com/v2.0/tokens -X POST -d '{ "auth":{"RAX-KSKEY:apiKeyCredentials": { "username":"'$USERNAME'", "apiKey": "'$APIKEY'" }} }' -H "Content-type: application/json" |  python -mjson.tool | grep -A5 token | grep id | cut -d '"' -f4`

curl -s -v  \
-H "X-Auth-Token: $TOKEN"  \
-H "X-Project-Id: $ACCOUNT_NUMBER" \
-H "Accept: application/json"  \
-X POST -d @create-network.json "$API_ENDPOINT/networks" | python -mjson.tool

For the above code to create a new network you need to create the create-network.json markup file, it needs to look like and be in this format:

{
    "network":
    {
        "name": "Isolatednet",
        "shared": false,
        "tenant_id": "10010101"
    }
}

It’s important to note you need to define the tenant_id, thats your account number that appears in the URL when you login to mycloud control panel.

Output looks like

* Connection #0 to host lon.networks.api.rackspacecloud.com left intact
{
    "network": {
        "admin_state_up": true,
        "id": "ae36972f-5cba-4327-8bff-15d8b05dc3ee",
        "name": "Isolatednet",
        "shared": false,
        "status": "ACTIVE",
        "subnets": [],
        "tenant_id": "10045567"
    }
}

Troubleshooting Networking, initial steps

At work we see a lot of stuff come up from day to day, and one of the issues which we see every now and then is networking issues. Specifically Rackspace Cloud Networks (project name is neutron). This is the ‘Rackspace’ implementation of isolated network entities. Amazon use VPC, virtual private cloud, but the concepts are quite similar.

In this case one of our customers web machines wasn’t able to ping other machines. The first thing I did was ask the customer to ping the other machine from their web machine, and ping the web machine from the other machine.

In this case the customer was reporting problems with isolated network, (i.e. not public or private interfaces), so not eth0, or eth1, but the eth2 interface in this case. Here is what my tcpdump on the hypervisor looked like.

$ tcpdump vif{domainid}{network}

10:28:30.542146 bc:76:4e:09:2a:69 > bc:76:4e:08:43:86, ethertype ARP (0x0806), length 42: Request who-has 192.168.66.19 tell 192.168.66.3, length 28
10:28:30.542486 bc:76:4e:08:43:86 > bc:76:4e:09:2a:69, ethertype ARP (0x0806), length 42: Reply 192.168.66.19 is-at bc:76:4e:08:43:86, length 28
10:28:30.571805 bc:76:4e:09:2a:69 > bc:76:4e:08:43:86, ethertype IPv4 (0x0800), length 98: 192.168.66.3 > 192.168.66.19: ICMP echo request, id 29516, seq 6, length 64
10:28:31.579785 bc:76:4e:09:2a:69 > bc:76:4e:08:43:86, ethertype IPv4 (0x0800), length 98: 192.168.66.3 > 192.168.66.19: ICMP echo request, id 29516, seq 7, length 64
10:28:32.587837 bc:76:4e:09:2a:69 > bc:76:4e:08:43:86, ethertype IPv4 (0x0800), length 98: 192.168.66.3 > 192.168.66.19: ICMP echo request, id 29516, seq 8, length 64

As we can see as 192.168.66.19 is being pinged by 192.168.66.3 but there is no ping reply. If it had a reply it would look different, something like:

192.168.66.3 < 192.168.66.19: ICMP echo request, id 29516, seq 7, length 64

192.168.66.3 is broadcasting the ARP request. Asking the local router to tell it what macid 192.168.66.19 has. This is answered and the physical hardware mac address is given '192.168.66.19 is-at bc:76:4e:08:43:86', but still 192.168.66.3 isn't sending an ping echo reply.

From the ARP request we can see 192.168.66.3 knows where to physically send the packet reply to .19 and this goes thru the local switch to reach the router. On the router there is a routing table that manages which macid is destined for which ip.

In this case something wrong was happening. For some reason 192.168.66.3 wasn't able to reply to the pings from 192.168.66.19, even with the physical hardware mac address.

However the weird thing is, the problem suddenly went away again!

11:09:26.735818 bc:76:4e:09:2a:69 > bc:76:4e:08:43:86, ethertype IPv4 (0x0800), length 98: 192.168.66.3 > 192.168.66.19: ICMP echo request, id 29516, seq 2453, length 64
11:09:27.197715 bc:76:4e:08:43:86 > bc:76:4e:09:2a:69, ethertype IPv4 (0x0800), length 98: 192.168.66.19 > 192.168.66.3: ICMP echo request, id 53772, seq 232, length 64
11:09:27.198315 bc:76:4e:09:2a:69 > bc:76:4e:08:43:86, ethertype IPv4 (0x0800), length 98: 192.168.66.3 > 192.168.66.19: ICMP echo reply, id 53772, seq 232, length 64
11:09:27.743907 bc:76:4e:09:2a:69 > bc:76:4e:08:43:86, ethertype IPv4 (0x0800), length 98: 192.168.66.3 > 192.168.66.19: ICMP echo request, id 29516, seq 2454, length 64
11:09:28.198486 bc:76:4e:08:43:86 > bc:76:4e:09:2a:69, ethertype IPv4 (0x0800), length 98: 192.168.66.19 > 192.168.66.3: ICMP echo request, id 53772, seq 233, length 64
11:09:28.201819 bc:76:4e:09:2a:69 > bc:76:4e:08:43:86, ethertype IPv4 (0x0800), length 98: 192.168.66.3 > 192.168.66.19: ICMP echo reply, id 53772, seq 233, length 64
11:09:28.751893 bc:76:4e:09:2a:69 > bc:76:4e:08:43:86, ethertype IPv4 (0x0800), length 98: 192.168.66.3 > 192.168.66.19: ICMP echo request, id 29516, seq 2455, length 64
11:09:29.203245 bc:76:4e:08:43:86 > bc:76:4e:09:2a:69, ethertype IPv4 (0x0800), length 98: 192.168.66.19 > 192.168.66.3: ICMP echo request, id 53772, seq 234, length 64
11:09:29.203737 bc:76:4e:09:2a:69 > bc:76:4e:08:43:86, ethertype IPv4 (0x0800), length 98: 192.168.66.3 > 192.168.66.19: ICMP echo reply, id 53772, seq 234, length 64
11:09:29.759691 bc:76:4e:09:2a:69 > bc:76:4e:08:43:86, ethertype IPv4 (0x0800), length 98: 192.168.66.3 > 192.168.66.19: ICMP echo request, id 29516, seq 2456, length 64
11:09:30.203991 bc:76:4e:08:43:86 > bc:76:4e:09:2a:69, ethertype IPv4 (0x0800), length 98: 192.168.66.19 > 192.168.66.3: ICMP echo request, id 53772, seq 235, length 64
11:09:30.204516 bc:76:4e:09:2a:69 > bc:76:4e:08:43:86, ethertype IPv4 (0x0800), length 98: 192.168.66.3 > 192.168.66.19: ICMP echo reply, id 53772, seq 235, length 64

All of a sudden the echo reply were coming back from 192.168.66.3 and it was finding 192.168.66.19.

192.168.66.3 pings 192.168.66.19

11:09:27.197715 bc:76:4e:08:43:86 > bc:76:4e:09:2a:69, ethertype IPv4 (0x0800), length 98: 192.168.66.19 > 192.168.66.3: ICMP echo request, id 53772, seq 232, length 64

192.168.66.19 responds back to 192.168.66.3

11:09:27.198315 bc:76:4e:09:2a:69 > bc:76:4e:08:43:86, ethertype IPv4 (0x0800), length 98: 192.168.66.3 > 192.168.66.19: ICMP echo reply, id 53772, seq 232, length 64

The question, ultimate question is WHY. I don't know why, but I shown you how to see WHAT and WHERE. Which is the most pertinent way to begin reaching a why ;D

Testing CDN Consistency with bash date time curl while loop

This is a simple one. Soa customer was complaining that after 3 minutes the cache time of the file on his CDN was changing. I wanted to built a way to test the consistency of the requests. Here is how I did it.

file curl-format.txt

     timenamelookup:  %{time_namelookup}\n
       time_connect:  %{time_connect}\n
    time_appconnect:  %{time_appconnect}\n
   time_pretransfer:  %{time_pretransfer}\n
      time_redirect:  %{time_redirect}\n
 time_starttransfer:  %{time_starttransfer}\n
                    ----------\n
         time_total:  %{time_total}\n

Short, simple, and to the point;

while ((1!=0)); do date; curl -w "@curl-format.txt" -o /dev/null -s "https://www.somecdndomain.secure.raxcdn.com/img/upload/3someimage_t32337827238.jpg"; done;

Output looks like:

                    ----------
         time_total:  0.395
Tue Feb  9 09:03:28 UTC 2016
      time_namelookup:  0.151
       time_connect:  0.154
    time_appconnect:  0.332
   time_pretransfer:  0.333
      time_redirect:  0.000
 time_starttransfer:  0.338
                    ----------
         time_total:  0.351
Tue Feb  9 09:03:28 UTC 2016
      time_namelookup:  0.151
       time_connect:  0.154
    time_appconnect:  0.324
   time_pretransfer:  0.324
      time_redirect:  0.000
 time_starttransfer:  0.331
                    ----------
         time_total:  0.347
Tue Feb  9 09:03:29 UTC 2016
      time_namelookup:  0.151
       time_connect:  0.154
    time_appconnect:  0.385
   time_pretransfer:  0.385
      time_redirect:  0.000
 time_starttransfer:  0.391
                    ----------
         time_total:  0.404
Tue Feb  9 09:03:29 UTC 2016
      time_namelookup:  0.151
       time_connect:  0.155
    time_appconnect:  0.348
   time_pretransfer:  0.349
      time_redirect:  0.000
 time_starttransfer:  0.357
                    ----------
         time_total:  0.374
Tue Feb  9 09:03:30 UTC 2016
      time_namelookup:  0.151
       time_connect:  0.155
    time_appconnect:  0.408
   time_pretransfer:  0.409
      time_redirect:  0.000
 time_starttransfer:  0.417
                    ----------
         time_total:  0.433
Tue Feb  9 09:03:30 UTC 2016

pretty handy andy.

With headers

# while ((1!=0)); do date; curl -IL -w "@curl-format.txt" -s "https://www.scdn3.secure.raxcdn.com/img/upload/3_sdsdsds6a9e80df0baa19863ffb8.jpg"; sleep 180; done;

Testing your servers available bandwidth & DDOS resiliency with iperf

So, if you buy a server with say a 1.6Gbps connection in this customers case, you might want to test you have the bandwidth you need, for instance to be resilient against small DOS and DDOS in the sub 500mbit -1000mbit range.

Here is how I did it (quick summary)


$ iperf -c somedestipiwanttospeedtest-censored -p 80 -P 2 -b 100m
WARNING: option -b implies udp testing
------------------------------------------------------------
Client connecting to somedestipiwanttospeedtest-censored, UDP port 80
Sending 1470 byte datagrams
UDP buffer size:  208 KByte (default)
------------------------------------------------------------
[  4] local someipsrc port 53898 connected with somedestipiwanttospeedtest-censored port 80
[  3] local someipsrc port 50460 connected with somedestipiwanttospeedtest-censored port 80


[ ID] Interval       Transfer     Bandwidth
[  4]  0.0-10.0 sec   120 MBytes   101 Mbits/sec
[  4] Sent 85471 datagrams
[  3]  0.0-10.0 sec   120 MBytes   101 Mbits/sec
[  3] Sent 85471 datagrams
[SUM]  0.0-10.0 sec   240 MBytes   201 Mbits/sec
[  3] WARNING: did not receive ack of last datagram after 10 tries.
[  4] WARNING: did not receive ack of last datagram after 10 tries.


$ iperf -c somedestipiwanttospeedtest-censored -p 80 -P 10 -b 100m
WARNING: option -b implies udp testing
------------------------------------------------------------
Client connecting to somedestipiwanttospeedtest-censored, UDP port 80
Sending 1470 byte datagrams
UDP buffer size:  208 KByte (default)
------------------------------------------------------------
[ 12] local someipsrc port 50725 connected with somedestipiwanttospeedtest-censored port 80
[  5] local someipsrc port 40410 connected with somedestipiwanttospeedtest-censored port 80
[  6] local someipsrc port 51075 connected with somedestipiwanttospeedtest-censored port 80
[  4] local someipsrc port 58020 connected with somedestipiwanttospeedtest-censored port 80
[  3] local someipsrc port 50056 connected with somedestipiwanttospeedtest-censored port 80
[  7] local someipsrc port 57017 connected with somedestipiwanttospeedtest-censored port 80
[  8] local someipsrc port 49473 connected with somedestipiwanttospeedtest-censored port 80
[  9] local someipsrc port 50491 connected with somedestipiwanttospeedtest-censored port 80
[ 10] local someipsrc port 40974 connected with somedestipiwanttospeedtest-censored port 80
[ 11] local someipsrc port 38348 connected with somedestipiwanttospeedtest-censored port 80
[ ID] Interval       Transfer     Bandwidth
[ 12]  0.0-10.0 sec   114 MBytes  95.7 Mbits/sec
[ 12] Sent 81355 datagrams
[  5]  0.0-10.0 sec   114 MBytes  95.8 Mbits/sec
[  5] Sent 81448 datagrams
[  6]  0.0-10.0 sec   114 MBytes  95.8 Mbits/sec
[  6] Sent 81482 datagrams
[  4]  0.0-10.0 sec   114 MBytes  95.7 Mbits/sec
[  4] Sent 81349 datagrams
[  3]  0.0-10.0 sec   114 MBytes  95.7 Mbits/sec
[  3] Sent 81398 datagrams
[  7]  0.0-10.0 sec   114 MBytes  95.8 Mbits/sec
[  7] Sent 81443 datagrams
[  8]  0.0-10.0 sec   114 MBytes  95.7 Mbits/sec
[  8] Sent 81408 datagrams
[  9]  0.0-10.0 sec   114 MBytes  95.8 Mbits/sec
[  9] Sent 81421 datagrams
[ 10]  0.0-10.0 sec   114 MBytes  95.7 Mbits/sec
[ 10] Sent 81404 datagrams
[ 11]  0.0-10.0 sec   114 MBytes  95.8 Mbits/sec
[ 11] Sent 81427 datagrams
[SUM]  0.0-10.0 sec  1.11 GBytes   957 Mbits/sec


It looks like you are getting the bandwidth you desire, when repeating the test with 20 connections I can see the bandwidth hits a total of 2.01Gbits/sec

# iperf -c somedestipiwanttospeedtest-censored -p 80 -P 20 -b 100m
WARNING: option -b implies udp testing
------------------------------------------------------------
Client connecting to somedestipiwanttospeedtest-censored, UDP port 80
Sending 1470 byte datagrams
UDP buffer size:  208 KByte (default)
------------------------------------------------------------
[ 22] local someipsrc port 44231 connected with somedestipiwanttospeedtest-censored port 80
[  4] local someipsrc port 55259 connected with somedestipiwanttospeedtest-censored port 80
[  7] local someipsrc port 49519 connected with somedestipiwanttospeedtest-censored port 80
[  3] local someipsrc port 45301 connected with somedestipiwanttospeedtest-censored port 80
[  6] local someipsrc port 48654 connected with somedestipiwanttospeedtest-censored port 80
[  5] local someipsrc port 33666 connected with somedestipiwanttospeedtest-censored port 80
[  8] local someipsrc port 33963 connected with somedestipiwanttospeedtest-censored port 80
[  9] local someipsrc port 39593 connected with somedestipiwanttospeedtest-censored port 80
[ 10] local someipsrc port 36229 connected with somedestipiwanttospeedtest-censored port 80
[ 11] local someipsrc port 36331 connected with somedestipiwanttospeedtest-censored port 80
[ 14] local someipsrc port 54622 connected with somedestipiwanttospeedtest-censored port 80
[ 13] local someipsrc port 36159 connected with somedestipiwanttospeedtest-censored port 80
[ 12] local someipsrc port 53881 connected with somedestipiwanttospeedtest-censored port 80
[ 15] local someipsrc port 43221 connected with somedestipiwanttospeedtest-censored port 80
[ 16] local someipsrc port 60284 connected with somedestipiwanttospeedtest-censored port 80
[ 17] local someipsrc port 49735 connected with somedestipiwanttospeedtest-censored port 80
[ 18] local someipsrc port 43866 connected with somedestipiwanttospeedtest-censored port 80
[ 19] local someipsrc port 44631 connected with somedestipiwanttospeedtest-censored port 80
[ 20] local someipsrc port 56852 connected with somedestipiwanttospeedtest-censored port 80
[ 21] local someipsrc port 59338 connected with somedestipiwanttospeedtest-censored port 80
[ ID] Interval       Transfer     Bandwidth
[ 22]  0.0-10.0 sec   120 MBytes   101 Mbits/sec
[ 22] Sent 85471 datagrams
[  4]  0.0-10.0 sec   120 MBytes   101 Mbits/sec
[  4] Sent 85449 datagrams
[  7]  0.0-10.0 sec   120 MBytes   101 Mbits/sec
[  7] Sent 85448 datagrams
[  3]  0.0-10.0 sec   120 MBytes   101 Mbits/sec
[  3] Sent 85448 datagrams
[  6]  0.0-10.0 sec   120 MBytes   101 Mbits/sec
[  6] Sent 85449 datagrams
[  5]  0.0-10.0 sec   120 MBytes   101 Mbits/sec
[  5] Sent 85448 datagrams
[  8]  0.0-10.0 sec   120 MBytes   101 Mbits/sec
[  8] Sent 85453 datagrams
[  9]  0.0-10.0 sec   120 MBytes   101 Mbits/sec
[  9] Sent 85453 datagrams
[ 10]  0.0-10.0 sec   120 MBytes   101 Mbits/sec
[ 10] Sent 85454 datagrams
[ 11]  0.0-10.0 sec   120 MBytes   101 Mbits/sec
[ 11] Sent 85456 datagrams
[ 14]  0.0-10.0 sec   120 MBytes   101 Mbits/sec
[ 14] Sent 85457 datagrams
[ 13]  0.0-10.0 sec   120 MBytes   101 Mbits/sec
[ 13] Sent 85457 datagrams
[ 12]  0.0-10.0 sec   120 MBytes   101 Mbits/sec
[ 12] Sent 85457 datagrams
[ 15]  0.0-10.0 sec   120 MBytes   101 Mbits/sec
[ 15] Sent 85460 datagrams
[ 16]  0.0-10.0 sec   120 MBytes   101 Mbits/sec
[ 16] Sent 85461 datagrams
[ 17]  0.0-10.0 sec   120 MBytes   101 Mbits/sec
[ 17] Sent 85462 datagrams
[ 18]  0.0-10.0 sec   120 MBytes   101 Mbits/sec
[ 18] Sent 85464 datagrams
[ 19]  0.0-10.0 sec   120 MBytes   101 Mbits/sec
[ 19] Sent 85467 datagrams
[ 20]  0.0-10.0 sec   120 MBytes   101 Mbits/sec
[ 20] Sent 85467 datagrams
[ 21]  0.0-10.0 sec   120 MBytes   101 Mbits/sec
[ 21] Sent 85467 datagrams
[SUM]  0.0-10.0 sec  2.34 GBytes  2.01 Gbits/sec

The last test I did used 2 connections only at 500mbit each;

# iperf -c somedestipiwanttospeedtest-censored -p 80 -P 2 -b 500m
WARNING: option -b implies udp testing
------------------------------------------------------------
Client connecting to somedestipiwanttospeedtest-censored, UDP port 80
Sending 1470 byte datagrams
UDP buffer size:  208 KByte (default)
------------------------------------------------------------
[  4] local someipsrc port 60841 connected with somedestipiwanttospeedtest-censored port 80
[  3] local someipsrc port 51495 connected with somedestipiwanttospeedtest-censored port 80
[ ID] Interval       Transfer     Bandwidth
[  4]  0.0-10.0 sec   570 MBytes   479 Mbits/sec
[  4] Sent 406935 datagrams
[  3]  0.0-10.0 sec   570 MBytes   479 Mbits/sec
[  3] Sent 406933 datagrams
[SUM]  0.0-10.0 sec  1.11 GBytes   957 Mbits/sec

Disable TCP Offloading on Linux NIC

# read -p "Interface: " iface; ethtool -k $iface | awk -F: '/offload: on$/{print$1}' | sed 's/^\(.\).*-\(.\).*-\(.\).*/\1\2\3/' | xargs --no-run-if-empty -n1 -I{} ethtool -K $iface {} off


Disable offloading for all interfaces:

# for iface in $(cd /sys/class/net; echo *); do ethtool -k $iface | awk -F: '/offload: on$/{print$1}' | sed 's/^\(.\).*-\(.\).*-\(.\).*/\1\2\3/' | xargs --no-run-if-empty -n1 -I{} ethtool -K $iface {} off; done

A big thank you to Daniel C. for this!

Perform a traceroute thru the Rackspace monitoring API

So, I was thinking about the Rackspace traceroute monitoring API and wondering what I could do with it, when I come across this gem

/monitoring_zones/mzsyd/traceroute

Well what is it you ask. Well it’s an API path for performing a traceroute on the 6 different region endpoints. This means you can use an API call to run traceroutes (for free!) thru the Rackspace cloud monitoring API. This would be pretty handy at testing connectivity around the world to your chosen destination from each datacentre. Handy Andy.

Then you ask what does the mzsyd mean? That’s a region ID: Let’s see about putting together a script to list the region ID’s we can run the traceroutes on first of all:

File: list-monitoring-zones.sh

!/bin/bash

USERNAME='mycloudusername'
APIKEY='mycloudapikey'
ACCOUNTNUMBER='10010110'
API_ENDPOINT="https://monitoring.api.rackspacecloud.com/v1.0/$ACCOUNTNUMBER"


TOKEN=`curl https://identity.api.rackspacecloud.com/v2.0/tokens -X POST -d '{ "auth":{"RAX-KSKEY:apiKeyCredentials": { "username":"'$USERNAME'", "apiKey": "'$APIKEY'" }} }' -H "Content-type: application/json" |  python -mjson.tool | grep -A5 token | grep id | cut -d '"' -f4`


curl -s -v  \
-H "X-Auth-Token: $TOKEN"  \
-H "X-Project-Id: $ACCOUNTNUMBER" \
-H "Accept: application/json"  \
-X GET  \
"$API_ENDPOINT/monitoring_zones"

Lets take a look at the response when I run this monitoring zone list.


chmod +x list-monitoring-zones.sh
./list-monitoring-zones.sh

Response

< Content-Type: application/json; charset=UTF-8
< Via: 1.1 Repose (Repose/7.3.0.0)
< Vary: Accept-Encoding
< X-LB: api1.dfw1.prod.cm.k1k.me
< Transfer-Encoding: chunked
<
{
    "values": [
        {
            "id": "mzdfw",
            "label": "Dallas Fort Worth (DFW)",
            "country_code": "US",
            "source_ips": [
                "2001:4800:7902:0001::/64",
                "50.56.142.128/26"
            ]
        },
        {
            "id": "mzhkg",
            "label": "Hong Kong (HKG)",
            "country_code": "HK",
            "source_ips": [
                "2401:1800:7902:0001::/64",
                "180.150.149.64/26"
            ]
        },
        {
            "id": "mziad",
            "label": "Northern Virginia (IAD)",
            "country_code": "US",
            "source_ips": [
                "2001:4802:7902:0001::/64",
                "69.20.52.192/26"
            ]
        },
        {
            "id": "mzlon",
            "label": "London (LON)",
            "country_code": "GB",
            "source_ips": [
                "2a00:1a48:7902:0001::/64",
                "78.136.44.0/26"
            ]
        },
        {
            "id": "mzord",
            "label": "Chicago (ORD)",
            "country_code": "US",
            "source_ips": [
                "2001:4801:7902:0001::/64",
                "50.57.61.0/26"
            ]
        },
        {
            "id": "mzsyd",
            "label": "Sydney (SYD)",
            "country_code": "AU",
            "source_ips": [
                "2401:1801:7902:0001::/64",
                "119.9.5.0/26"
            ]
        }
    ],
    "metadata": {
        "count": 6,
        "limit": 100,
        "marker": null,
        "next_marker": null,
        "next_href": null
    }
* Connection #0 to host monitoring.api.rackspacecloud.com left intact

We can see many zones available to run our traceroute to;

id 'mzsyd' for Sydney SYD.
id 'mzdfw' for Dallas Fort Worth DFW
id 'mzhkg' for Hong Kong HKG
id 'mziad' for Northern Viginia IAD
id 'mzord' for Chicago ORD
id 'mzlon' for London LON

So now I know what the zone id's are, as defined above here. Now time to use them and run a traceroute to haxed.me.uk. Lets see;

File: perform-traceroute-from-monitoring-zone.sh

!/bin/bash

USERNAME='mycloudusernamehere'
APIKEY='apikeyhere'
ACCOUNTNUMBER=10010110
API_ENDPOINT="https://monitoring.api.rackspacecloud.com/v1.0/$ACCOUNTNUMBER"


TOKEN=`curl https://identity.api.rackspacecloud.com/v2.0/tokens -X POST -d '{ "auth":{"RAX-KSKEY:apiKeyCredentials": { "username":"'$USERNAME'", "apiKey": "'$APIKEY'" }} }' -H "Content-type: application/json" |  python -mjson.tool | grep -A5 token | grep id | cut -d '"' -f4`


curl -s -v  \
-H "X-Auth-Token: $TOKEN"  \
-H "X-Project-Id: $ACCOUNTNUMBER" \
-H "Accept: application/json"  \
-d @ip.json -H "content-type: application/json" -X POST  \
"$API_ENDPOINT/monitoring_zones/mzsyd/traceroute"

You also need the ip.json file. It's easy to make, put it in the same dir as the shellscript.

File: ip.json

{
        "target":               "haxed.me.uk",
        "target_resolver":      "IPv4"
}

We're going to refer to ip.json file which contains our destination data. You can do this with IPv6 IP's too if you wanted! That is pretty cool!
It is possible to do this without including the file, and actually just pass the json directly, with -d { "target": "haxed.me.uk", "target_resolver": "IPv4"} , but lets do it properly 😀


chmod +x perform-traceroute-from-monitoring-zone.sh
./perform-traceroute-from-monitoring-zone

the response, a nice traceroute of course from syd to my lon server.

Response

 Accept: application/json
> content-type: application/json
> Content-Length: 55
>
* upload completely sent off: 55 out of 55 bytes
< HTTP/1.1 200 OK
< Date: Wed, 13 Jan 2016 11:19:14 GMT
< Server: Jetty(9.2.z-SNAPSHOT)
< X-RateLimit-Type: traceroute
< X-RateLimit-Remaining: 296
< X-RateLimit-Window: 24 hours
< x-trans-id: eyJyZXF1ZXN0SWQiOiI5MTNhNTY1Mi05ODAyLTQ5MmQtOTAwYS05NDU1M2ZhNDJmNzUiLCJvcmlnaW4
< X-RateLimit-Limit: 300
< X-Response-Id: .rh-TI8E.h-api1.ord1.prod.cm.k1k.me.r-4RFTh9up.c-28452540.ts-1452683954386.v-91eaf0a
< Content-Type: application/json; charset=UTF-8
< Via: 1.1 Repose (Repose/7.3.0.0)
< Vary: Accept-Encoding
< X-LB: api0.ord1.prod.cm.k1k.me
< Transfer-Encoding: chunked
<
{
    "result": [
        {
            "ip": "119.9.5.2",
            "hostname": null,
            "number": 1,
            "rtts": [
                0.421,
                0.384,
                0.442,
                0.457,
                0.455
            ]
        },
        {
            "ip": "119.9.0.30",
            "hostname": null,
            "number": 2,
            "rtts": [
                1.015,
                0.872,
                0.817,
                1.014,
                0.926
            ]
        },
        {
            "ip": "119.9.0.109",
            "hostname": null,
            "number": 3,
            "rtts": [
                1.203,
                1.179,
                1.185,
                1.232,
                1.182
            ]
        },
        {
            "ip": "202.84.223.2",
            "hostname": null,
            "number": 4,
            "rtts": [
                3.53,
                5.301,
                3.975,
                5.772,
                3.804
            ]
        },
        {
            "ip": "202.84.223.1",
            "hostname": null,
            "number": 5,
            "rtts": [
                3.437,
                3.522,
                2.837,
                4.274,
                2.805
            ]
        },
        {
            "ip": "202.84.140.206",
            "hostname": null,
            "number": 6,
            "rtts": [
                141.198,
                140.746,
                143.871,
                140.987,
                141.545
            ]
        },
        {
            "ip": "202.40.149.238",
            "hostname": null,
            "number": 7,
            "rtts": [
                254.354,
                175.559,
                176.787,
                176.701,
                175.634
            ]
        },
        {
            "ip": "134.159.63.18",
            "hostname": null,
            "number": 8,
            "rtts": [
                175.302,
                175.299,
                175.183,
                175.146,
                175.149
            ]
        },
        {
            "ip": "64.125.26.6",
            "hostname": null,
            "number": 9,
            "rtts": [
                175.395,
                175.408,
                175.469,
                175.49,
                175.475
            ]
        },
        {
            "ip": "64.125.30.184",
            "hostname": null,
            "number": 10,
            "rtts": [
                285.818,
                285.872,
                285.801,
                285.835,
                285.887
            ]
        },
        {
            "ip": "64.125.29.52",
            "hostname": null,
            "number": 11,
            "rtts": [
                285.864,
                285.938,
                285.826,
                285.922,
                303.125
            ]
        },
        {
            "ip": "64.125.28.98",
            "hostname": null,
            "number": 12,
            "rtts": [
                284.711,
                284.865,
                284.73,
                284.697,
                284.713
            ]
        },
        {
            "ip": "64.125.29.48",
            "hostname": null,
            "number": 13,
            "rtts": [
                287.341,
                310.82,
                287.33,
                287.359,
                287.455
            ]
        },
        {
            "ip": "64.125.29.130",
            "hostname": null,
            "number": 14,
            "rtts": [
                286.168,
                286.012,
                286.108,
                286.105,
                286.168
            ]
        },
        {
            "ip": "64.125.30.235",
            "hostname": null,
            "number": 15,
            "rtts": [
                284.61,
                284.681,
                284.667,
                284.892,
                286.069
            ]
        },
        {
            "ip": "64.125.20.97",
            "hostname": null,
            "number": 16,
            "rtts": [
                287.516,
                287.435,
                287.557,
                287.581,
                287.438
            ]
        },
        {
            "ip": "94.31.42.254",
            "hostname": null,
            "number": 17,
            "rtts": [
                288.156,
                288.019,
                288.034,
                288.08
            ]
        },
        {
            "ip": null,
            "hostname": null,
            "number": 18,
            "rtts": []
        },
        {
            "ip": "134.213.131.251",
            "hostname": null,
            "number": 19,
            "rtts": [
                292.687,
                293.72,
                295.335,
                293.981
            ]
        },
        {
            "ip": "162.13.232.1",
            "hostname": null,
            "number": 20,
            "rtts": [
                293.295,
                293.738,
                295.46,
                294.301
            ]
        },
        {
            "ip": "162.13.232.103",
            "hostname": null,
            "number": 21,
            "rtts": [
                294.733,
                294.996,
                298.884,
                295.056
            ]
        },
        {
            "ip": "162.13.136.211",
            "hostname": null,
            "number": 22,
            "rtts": [
                294.919,
                294.77,
                298.956,
                296.481
            ]
        }
    ]
* Connection #0 to host monitoring.api.rackspacecloud.com left intact

This is pretty cool. If we want to run a traceroute from lets say chicago, we just swap out the 'mzsyd' variable to show 'mziad', wow thats simple 🙂

Securing your segmented Network, and interpretation of tcpdump on dual NIC segmented network

Howdy! So, here is a real life example of some basic networking security analysis.

Without giving too much away about the way my own home network works. I have a basic firewall-like setup segmenting my red internet routers network offering from the nic port handling my local network. This offers a level of separation or isolation, that prevents any-old-packet reaching the local network. By default I am allowing services to be routed out to internets only when it is requested first by an application running on boxes inside the local network. If any external client attempts to connect to my router on a particular port without it being SYN ACK, then it won’t be accepted.

Another good thing is it’s easy to find out what destination and source is because eth1 shows me primarily all internet bound and internet from traffic, and the eth0 adapter shows me primarily all local traffic on it’s way to be internet bound thru the firewall and then out the other NIC.

Today I saw some worrying traffic coming thru on eth1, something called teamview;

Here is what it looked like:

# tcpdump -i eth1 | grep teamview
tcpdump: verbose output suppressed, use -v or -vv for full protocol decode
listening on eth1, link-type EN10MB (Ethernet), capture size 65535 bytes
16:07:05.641711 IP firewall.home.50490 > server19703.teamviewer.com.https: Flags [P.], seq 2473010817:2473010841, ack 788873912, win 255, length 24
16:07:05.676803 IP server19703.teamviewer.com.https > firewall.home.50490: Flags [P.], seq 1:25, ack 24, win 251, length 24
16:07:05.891233 IP firewall.home.50490 > server19703.teamviewer.com.https: Flags [.], ack 25, win 255, length 0

As we can see the firewall just ‘dialed’ out to a remote server19703, and I am like ‘wtf’ is this? So I start to panic, then I run:

]# tcpdump -i eth0 | grep teamview
tcpdump: verbose output suppressed, use -v or -vv for full protocol decode
listening on eth0, link-type EN10MB (Ethernet), capture size 65535 bytes
16:07:05.641686 IP 192.168.0.120.50490 > server19703.teamviewer.com.https: Flags [P.], seq 2473010817:2473010841, ack 788873912, win 255, length 24
16:07:05.676846 IP server19703.teamviewer.com.https > 192.168.0.120.50490: Flags [P.], seq 1:25, ack 24, win 251, length 24
16:07:05.891204 IP 192.168.0.120.50490 > server19703.teamviewer.com.https: Flags [.], ack 25, win 255, length 0

This allows me to see, what the nature of the request was, just before the firewall started to route it out on the eth1 adapter. As such it shows me that the local network machine devices ip address on eth0, which is 192.168.0.120, or in other words, my parentals new computer, specifically the one I bought them for christmas from ebay.

What does this mean? It means I’ll be paying a visit to their box to make sure that this is disabled.