Checking Load Balancer Connectivity & Automating it in some interesting ways

So, in a dream last night, I woke up realising I had forgot to write my automated load balancer connectivity checker.

Basically, sometimes a customer will complain their site is down because their ‘load balancer is broken’! In many cases, this is actually due to a firewall on one of the nodes behind the load balancer, or an issue with the webserver application listening on the port. So, I wrote a little piece of automation in the form of a BASH script, that accepts an Load Balancer ID and then uses the API to pull the server nodes behind that Load Balancer, including the ports being used to communicate, and then uses, either netcat or nmap to check that port for connectivity. There were a few ways to achieve this, but the below is what I was happiest with.

#!/bin/bash

# Username used to login to control panel
USERNAME='mycloudusernamegoeshere'

# Find the APIKey in the 'account settings' part of the menu of the control panel
APIKEY="apikeygoeshere"

# Your Rackspace account number (the number that is in the URL of the control panel after logging in)
ACCOUNT=100101010

# Your Rackspace loadbalancerID
LOADBALANCERID=157089

# Rackspace LoadBalancer Endpoint
ENDPOINT="https://lon.loadbalancers.api.rackspacecloud.com/v1.0"

# This section simply retrieves and sets the TOKEN
TOKEN=`curl https://identity.api.rackspacecloud.com/v2.0/tokens -X POST -d '{ "auth":{"RAX-KSKEY:apiKeyCredentials": { "username":"'$USERNAME'", "apiKey": "'$APIKEY'" }} }' -H "Content-type: application/json" |  python -mjson.tool | grep -A5 token | grep id | cut -d '"' -f4`

#   (UNUSED) METHOD 1Extract IP addresses (Currently assuming port 80 only)
#curl -H "X-Auth-Token: $TOKEN" -H "Accept: application/json" -X GET "$ENDPOINT/$ACCOUNT/loadbalancers/$LOADBALANCERID/nodes" | jq .nodes[].address | xargs -i nmap -p 80 {}
#   (UNUSED) Extract ports
# curl -H "X-Auth-Token: $TOKEN" -H "Accept: application/json" -X GET "$ENDPOINT/$ACCOUNT/loadbalancers/$LOADBALANCERID/nodes" | jq .nodes[].port | xargs -i nmap -p 80 {}


# I opted for using this method to extract the important detail
curl -H "X-Auth-Token: $TOKEN" -H "Accept: application/json" -X GET "$ENDPOINT/$ACCOUNT/loadbalancers/$LOADBALANCERID/nodes" | jq .nodes[].address | sed 's/"//g' > address.txt
curl -H "X-Auth-Token: $TOKEN" -H "Accept: application/json" -X GET "$ENDPOINT/$ACCOUNT/loadbalancers/$LOADBALANCERID/nodes" | jq .nodes[].port > port.txt

# Loop thru both output files sequentially, order is important
# WARNING script does not ignore whitespace

while read addressfile1 <&3 && read portfile2 <&4; do
   ncat $addressfile1 $portfile2
done 3

Output looks a bit like;

# ./lbtest.sh
% Total % Received % Xferd Average Speed Time Time Time Current
Dload Upload Total Spent Left Speed
100 5143 100 5028 100 115 4731 108 0:00:01 0:00:01 --:--:-- 4734
% Total % Received % Xferd Average Speed Time Time Time Current
Dload Upload Total Spent Left Speed
100 225 100 225 0 0 488 0 --:--:-- --:--:-- --:--:-- 488
% Total % Received % Xferd Average Speed Time Time Time Current
Dload Upload Total Spent Left Speed
100 225 100 225 0 0 679 0 --:--:-- --:--:-- --:--:-- 681
Ncat: No route to host.
Ncat: Connection timed out.

I plan to add some additional support that will check the load balancer is up, AND the servicenet connection between the cloud servers.

Please note that this script must be run on a machine with access to servicenet network, in the same Rackspace Datacenter to be able to check servicenet connectivity of servers. The script can give false positives if strict firewall rules are setup on the cloud server nodes behind the load balancer. It's kind of alpha-draft but I thought I would share it as a proof of concept.

You will need to download and install jq to use it. To download jq please see; https://stedolan.github.io/jq/download/

Pro actively Securing and Analyzing Login Attacks in WordPress and automating abuse reports

So, noticed there were a lot of failed logins being reported by my security software. So, I thought I’d do some manual digging around as to what is going on my box. Here is what I did.

Scan the physical packets coming in/out of the box

tcpdump -i eth0 | grep -v rackspace | grep -v newrelic | grep -v 212.121.212.121

This above line gave me lots of output. I could see a lot of ip’s were hitting tcp port 80 a lot, and I wondered why. Obviously it was a bruteforce login attack.

When analysing attacks it’s important to consult the webserver logs for all access, if port 80 http is being used as a vector of attack it is therefore important to identify which addresses are hitting sensitive files, such as wp-logon.php , this is what I expect is being targeted, so I will target them a little;

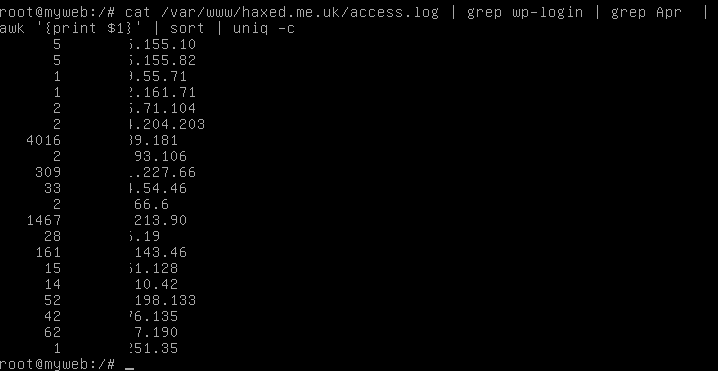
cat /some/path/to/mywebwww/access.log | grep wp-login | grep Apr | awk '{print $1}' | sort | uniq -c

What this does is output the entire webserver access log and only show requests that have wp-login in. Then it removes all entries from Apr, and then it extracts only the IP addresses of those accessing it, and then sorts them uniquely but also -c counting them too, so we know exactly how many access requests have been made to this sensitive wp-logon.php file in just 1 month.
This will allow us to identify the clear attackers and block them.

wp-login

Lets start blocking their access

iptables -I INPUT -s 1.1.1.1 -j DROP

The above line instructs the firewall to block the source ip 1.1.1.1 and DROP all packets coming in on the interface. Simple enough!

What I could do is take the line further, and find out exactly which networks these attacks are coming from by piping the ip addresses to whois. Lets do this now and extract some data we need to start making automated abuse reports with our script;

cat /somepath/www/access.log | grep wp-login | grep Apr | awk  '{print $1}' | sort | uniq | xargs -i echo "whois" {} | grep 'Organization\|AbuseEmail\|OrgAbusePhone'; echo;" > exec.sh;

 ./exec.sh

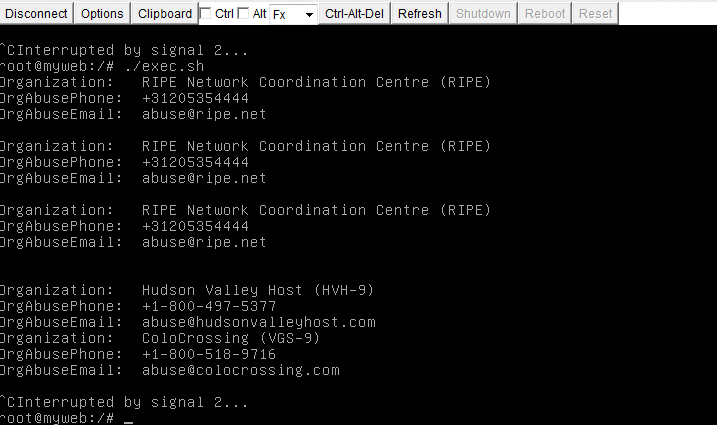
This is what the output looks like
ip-finder

Lets go one step further and refer to the {} output which has the initial IP argument. Then we’ll know which IP to email which abuse contact for when we pipe it to sendmail! ;D

cat /var/logs/access.log | grep wp-login | grep Apr | awk '{print $1}' | sort | uniq | xargs -i echo "echo {}" ";whois" {} "| grep 'OrgAbuseEmail';sleep 3;"

Output looks like

ip-abuse-email-output-automation

Sadly I run out of time with this.. but I will try and get the automatic abuse reporting finished soon 😀ip-abuse-email-output-automation

Installing Drupal 8 the hard way

Many people use phpmyadmin, but we’re going to do this properly to add users, databases and privileges. Heres how I did it.
Please note that this is a work in progress and is not finished yet .

Install httpd and mysql-server

yum install httpd mariadb-server php php-mysql

What you might find is that drupal 8 requires php5.5.9 lets install that;

[root@web-test-centos7 html]# yum install centos-release-scl
[root@web-test-centos7 html]# yum install php55-php-mysqlnd

Open Firewall port 80 http for CentOS

     sudo iptables -I INPUT 1 -p tcp --dport 80 -j ACCEPT
     sudo iptables -I INPUT 1 -p tcp --dport 443 -j ACCEPT

Save firewall rules in CentOS

/etc/init.d/iptables save

Alternatively, save firewall rules Ubuntu

iptables-save > /etc/iptables.rules

Save firewall rules for all other distros

iptables-save > /etc/sysconfig/iptables

Connect to MysQL to configure database user ‘drupal’

# mysql -u root
Welcome to the MariaDB monitor.  Commands end with ; or \g.
Your MariaDB connection id is 3
Server version: 5.5.47-MariaDB MariaDB Server

Copyright (c) 2000, 2015, Oracle, MariaDB Corporation Ab and others.

Type 'help;' or '\h' for help. Type '\c' to clear the current input statement.

Create Drupal database

MariaDB [(none)]> create database drupal;

Grant ability to connect with drupal user

MariaDB [(none)]> grant usage on *.* to drupal@localhost identified by '@#@DS45Dfddfdgj334k34ldfk;DF';
Query OK, 0 rows affected (0.00 sec)

Grant all Privileges to the user drupal for database drupal

MariaDB [(none)]> grant all privileges on drupal.* to drupal@localhost;
Query OK, 0 rows affected (0.00 sec)

Checking a crashing / unstable Server

So, what to do if a customer has a server which is frequently crashing? Well, important things to check is open files, to look at all the users in /etc/passwd and substitute the username to check each of their cron jobs and check the files which are open using the apache process id.

This will help rule out a lot of common issues being seen on servers, and may even be of use for checking whether the server has been hacked.

netstat -ntulp
for i in $(awk -F: '{print $1}' /etc/passwd); do crontab -l -u $i ;done
lsof -p $(cat /var/run/apache2/apache2.pid) | grep log

This is a nice one liner, thanks to my colleague Aaron for providing this, well, actually it was so awesome I stole it 😛

Fail2ban on CentOS 7 not working [and solution]

because configuration settings in fail2ban 0.9.0 having been completely re-factored, CentOS7 fail2ban hardening automation now is not safe by merely running an yum install fail2ban.

It will also apparently no longer work if you uncomment the sshd enabled jail in local.conf or jail.conf.

The newer re-factored configuration suggests to use a dedicated file for this to prevent being overwritten as I have now set in my /etc/fail2ban/jail.d/sshd.local

[sshd] enabled = true
port = ssh
#action = firewallcmd-ipset
logpath = %(sshd_log)s
maxretry = 5
bantime = 86400

Do note firewallcmd-ipset needs to be commented out or fail2ban will not start.

Once it has been configured like this, it is happy again. And worked straight away banning my home IP! Whilst before it was quite literally failing to ban :- )

Of course you might need to install it first:

yum install -y epel-release
yum install -y fail2ban fail2ban-systemd

You might also want to start fail2ban, and also set it to run on startup:

systemctl enable fail2ban
systemctl start fail2ban

If you run selinux, then you’ll need (running this command may have security implications)

yum update selinux-policy*

Checking Size of Database within MySQL

We had an issue where the rackspace intelligence monitor was giving a different value to the control panel instance of a dbaas. So I came up with a way of testing MySQL for the database size. There is nothing more reliable than running the query like this, I think.

SELECT table_schema AS "Database", 
ROUND(SUM(data_length + index_length) / 1024 / 1024, 2) AS "Size (MB)" 
FROM information_schema.TABLES 
GROUP BY table_schema;

Testing the consistency of response time on a website

So, we had some customers today complaining about inconsistent page load times. So I taken a look at the hypervisor they were on and I could see it was really quite busy. In the sense that all 122GB of RAM available was being used by server instances. Ironically though it wasn’t that busy, but I live-migrated the customer anyway to a much quieter server, but the customer saw no change whatsoever.

In this case it indicated already that it wasn’t a network infrastructure or hardware issue and likely the increase in latency they saw over the last so many days was being caused by something else. Most likely the growing size of their database, not being reflected by their static amount of ram and the variables set for their tablesize cache, and etc in MySQL.

So my friend kindly put together this excellent oneliner. Check it out!

$ for i in $(seq 50); do curl -sL http://www.google.com/ -o /dev/null -w %{time_total}\\n; sleep 1; done
0.698
0.493
0.365
0.293
0.326
0.525
0.342
0.527
0.445
0.263
0.493

Pretty neat eh