So a customer trying to add an SSL key to an Load Balancer which is passworded. No good!
openssl rsa -in SSL.key -out nopass-SSL.key
Thanks to my colleague Mike, who I stole this handy oneliner for.

So a customer trying to add an SSL key to an Load Balancer which is passworded. No good!
openssl rsa -in SSL.key -out nopass-SSL.key
Thanks to my colleague Mike, who I stole this handy oneliner for.
So a customer had flushed his iptables rules, and sadly wasn’t able to use SMTP and POP. So I put together this basic tutorial explaining how to do it!
The following ports are used for mail commonly:

SMTP 	587
POP 	110
POPS 	995
IMAP 	143
IMAP3 	993

To add these ports to the firewall rules;

# Allows SMTP access

iptables -A INPUT -p tcp --dport 25 -j ACCEPT

# Allows pop and pops connections

iptables -A INPUT -p tcp --dport 110 -j ACCEPT
iptables -A INPUT -p tcp --dport 995 -j ACCEPT

# Allows imap and imaps connections

iptables -A INPUT -p tcp --dport 143 -j ACCEPT
iptables -A INPUT -p tcp --dport 993 -j ACCEPT
I am working on a project at work to deploy Keystone and Glance. I’ve currently been tasked with finishing off the glance role part of the playbook with the basic setup tasks and retrieving the basic qcow2 images for the various distributions and automatically retrieving and populating the glance API image-list. Here is how I did it;
This is using an encrypted group_vars all vars.yml which contains sensitive password variables like GLANCE_DBPASS
This file shows how Glance SQL database, permissions, population and images are uploaded to glance for use by openstack compute.
File: osan/roles/glance/tasks/main.yml
---

   - name: Create keystone database
     mysql_db:
        name: glance

   - name: Configure database user privileges
     mysql_user:
       name: glance
       host: "{{ item }}"
       password: "{{ GLANCE_DBPASS }}"
       priv: glance.*:ALL
     with_items:
       - "%"
       - localhost

#   - name: Set credentials to admin
#   command: source admin-openrc.sh

   - name: Create the Glance user service credentials
     command: openstack user create --domain default --password {{ GLANCE_PASS }} glance
     environment: admin_env
     ignore_errors: yes

   - name: Add the admin role to the glance user and service project
     command: openstack role add --project service --user glance admin
     environment: admin_env
     ignore_errors: yes

   - name: Create the glance service entity
     command: openstack service create --name glance --description "OpenStack Image service" image
     environment: admin_env
     ignore_errors: yes

   - name: Create the Image service API endpoints for glance
     command: openstack endpoint create --region RegionOne image public http://controller:9292
     environment: admin_env
     ignore_errors: yes

   - name: Create the Image service API endpoints for glance
     command: openstack endpoint create --region RegionOne image internal http://controller:9292
     environment: admin_env
     ignore_errors: yes

   - name: Create the Image service API endpoints for glance
     command: openstack endpoint create --region RegionOne image admin 'http://controller:9292'
     environment: admin_env
     ignore_errors: yes

   - name: Install Glance and Dependencies
     yum: pkg={{item}} state=installed
     with_items:
     - openstack-glance
     - python-glance
     - python-glanceclient

   - name: replace glance-api.conf file
     template: src=glance-api.conf.ansible dest=/etc/glance/glance-api.conf owner=root

   - name: replace glance-registory.conf file
     template: src=glance-registry.conf.ansible dest=/etc/glance/glance-registory.conf owner=root

   - name: Populate the Image service database
     command: su -s /bin/sh -c "glance-manage db_sync" glance

   - name: Start & Enable openstack-glance-registry.service
     service: name=openstack-glance-registry.service enabled=yes state=started

   - name: Start & Enable openstack-glance-api.service
     service: name=openstack-glance-api.service enabled=yes state=started


   - name: Retrieve CentOS 7 x86_64.qcow2
     get_url: url=http://cloud.centos.org/centos/7/images/CentOS-7-x86_64-GenericCloud-1503.qcow2 dest=/root/CentOS-7-x86_64-GenericCloud-1503.qcow2 mode=0600

   - name: Populate Glance DB with CentOS 7 qcow2 Image
     command:  glance image-create --name "centos7-x86_x64" --file /root/CentOS-7-x86_64-GenericCloud-1503.qcow2 --disk-format qcow2 --container-format bare --visibility public --progress


   - name: Retrieve Cirros qcow2 Image
     get_url: url=http://download.cirros-cloud.net/0.3.4/cirros-0.3.4-x86_64-disk.img dest=/root/cirros-0.3.4-x86_64-disk.img mode=0600

   - name: Import Cirros qcow Image to Glance
     command:  glance image-create --name "cirros-0.3.4_x86_64" --file /root/cirros-0.3.4-x86_64-disk.img --disk-format qcow2 --container-format bare --visibility public --progress


   - name: Retrieve Ubuntu 14.04 Trusty Tahr qcow2 Image
     get_url: url=http://cloud-images.ubuntu.com/releases/14.04/release-20140416.1/ubuntu-14.04-server-cloudimg-amd64-disk1.img dest=/root/ubuntu-14.04-server-cloudimg-amd64-disk1.img mode=0600

   - name: Import Ubuntu 14.04 Trusty Tahr to Glance
     command: glance image-create --name "ubuntu-14.04-lts-trusty-tahr-amd64" --file /root/ubuntu-14.04-server-cloudimg-amd64-disk1.img --disk-format qcow2 --container-format bare --visibility public --progress


   - name: Retrieve Fedora 23 qcow2 Image
     get_url: url=https://download.fedoraproject.org/pub/fedora/linux/releases/23/Cloud/x86_64/Images/Fedora-Cloud-Base-23-20151030.x86_64.qcow2 dest=/root/Fedora-Cloud-Base-23-20151030.x86_64.qcow2 mode=0600

   - name: Import Fedora 23 qcow2 Image to Glance
     command: glance image-create --name "fedora-23-amd64" --file /root/Fedora-Cloud-Base-23-20151030.x86_64.qcow2 --disk-format qcow2 --container-format bare --visibility public --progress


   - name: Retrieve Debian 8 amd64 qcow2 Image
     get_url: url=http://cdimage.debian.org/cdimage/openstack/current/debian-8.2.0-openstack-amd64.qcow2 dest=/root/debian-8.2.0-openstack-amd64.qcow2 mode=0600

   - name: Import Debian 8 to Glance
     command: glance image-create --name "debian8-2-0-amd64" --file /root/debian-8.2.0-openstack-amd64.qcow2 --disk-format qcow2 --container-format bare --visibility public --progress


   - name: Retrieve OpenSuSE 13.2 Guest Qcow2 Image
     get_url: url=http://download.opensuse.org/repositories/Cloud:/Images:/openSUSE_13.2/images/openSUSE-13.2-OpenStack-Guest.x86_64.qcow2 dest=/root/openSUSE-13.2-OpenStack-Guest.x86_64.qcow2 mode=0600

   - name: Import OpenSuSE 13.2 to Glance
     command: glance image-create --name "opensuse-13-2-amd64" --file /root/openSUSE-13.2-OpenStack-Guest.x86_64.qcow2 --disk-format qcow2 --container-format bare --visibility public --progress
The above is in yaml format which is really tricky so what your syntax when using it. It is VERY sensitive.
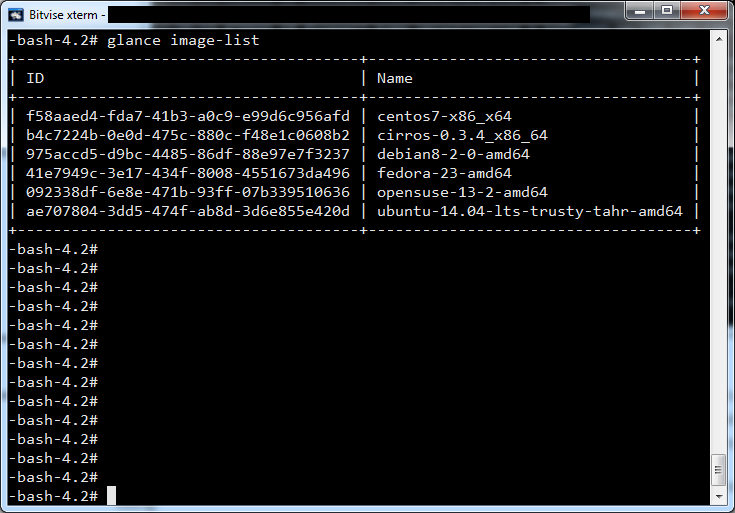
After this runs we are left with a nice glance image-list output. Glance is ready for compute to use the qcow2 images we associated using the openstack Glance API.
+--------------------------------------+------------------------------------+
| ID                                   | Name                               |
+--------------------------------------+------------------------------------+
| f58aaed4-fda7-41b3-a0c9-e99d6c956afd | centos7-x86_x64                    |
| b4c7224b-0e0d-475c-880c-f48e1c0608b2 | cirros-0.3.4_x86_64                |
| 975accd5-d9bc-4485-86df-88e97e7f3237 | debian8-2-0-amd64                  |
| 41e7949c-3e17-434f-8008-4551673da496 | fedora-23-amd64                    |
| 092338df-6e8e-471b-93ff-07b339510636 | opensuse-13-2-amd64                |
| ae707804-3dd5-474f-ab8d-3d6e855e420d | ubuntu-14.04-lts-trusty-tahr-amd64 |
+--------------------------------------+------------------------------------+
So today, a customer wanted to know if there was a way to export a Rackspace Cloud Server image out of Rackspace to download it. Yes, this is possible and can be done using the Images API and Cloud Files. Here is a summary of the basic process below;
Step 1: Make container called ‘export’ in cloud files; You can do this thru the mycloud control panel by navigating to your cloud files and simply clicking create container, call it ‘export’.

Step 2: Create bash script to query API with correct user, apikey and imageid;
vim mybashscript.sh
#!/bin/bash

# Username used to login to control panel
USERNAME='mycloudusernamehere'
# Find the APIKey in the 'account settings' part of the menu of the control panel
APIKEY='mycloudapikeyhere'
# Find the image ID you'd like to make available on cloud files
# set the image id below of the image you want to copy to cloud files, see in control panel
IMAGEID="5fb24bf2-afae-4277-b8fa-0b69bc98185a"

# This section simply retrieves the TOKEN
TOKEN=`curl https://identity.api.rackspacecloud.com/v2.0/tokens -X POST -d '{ "auth":{"RAX-KSKEY:apiKeyCredentials": { "username":"'$USERNAME'", "apiKey": "'$APIKEY'" }} }' -H "Content-type: application/json" |  python -mjson.tool | grep -A5 token | grep id | cut -d '"' -f4`

# This section requests the Glance API to copy the cloud server image uuid to a cloud files container called export
curl https://lon.images.api.rackspacecloud.com/v2/10045567/tasks -X POST -H "X-Auth-Token: $TOKEN" -H "Content-Type: application/json" -d '{"type": "export", "input": {"image_uuid": "'"$IMAGEID"'", "receiving_swift_container": "exports"}}'
It’s so simple I had to check myself that it was really this simple.
It is. yay! Next guide shows you how to download the image you made.
So, if you buy a server with say a 1.6Gbps connection in this customers case, you might want to test you have the bandwidth you need, for instance to be resilient against small DOS and DDOS in the sub 500mbit -1000mbit range.
Here is how I did it (quick summary)
$ iperf -c somedestipiwanttospeedtest-censored -p 80 -P 2 -b 100m
WARNING: option -b implies udp testing
------------------------------------------------------------
Client connecting to somedestipiwanttospeedtest-censored, UDP port 80
Sending 1470 byte datagrams
UDP buffer size:  208 KByte (default)
------------------------------------------------------------
[  4] local someipsrc port 53898 connected with somedestipiwanttospeedtest-censored port 80
[  3] local someipsrc port 50460 connected with somedestipiwanttospeedtest-censored port 80


[ ID] Interval       Transfer     Bandwidth
[  4]  0.0-10.0 sec   120 MBytes   101 Mbits/sec
[  4] Sent 85471 datagrams
[  3]  0.0-10.0 sec   120 MBytes   101 Mbits/sec
[  3] Sent 85471 datagrams
[SUM]  0.0-10.0 sec   240 MBytes   201 Mbits/sec
[  3] WARNING: did not receive ack of last datagram after 10 tries.
[  4] WARNING: did not receive ack of last datagram after 10 tries.


$ iperf -c somedestipiwanttospeedtest-censored -p 80 -P 10 -b 100m
WARNING: option -b implies udp testing
------------------------------------------------------------
Client connecting to somedestipiwanttospeedtest-censored, UDP port 80
Sending 1470 byte datagrams
UDP buffer size:  208 KByte (default)
------------------------------------------------------------
[ 12] local someipsrc port 50725 connected with somedestipiwanttospeedtest-censored port 80
[  5] local someipsrc port 40410 connected with somedestipiwanttospeedtest-censored port 80
[  6] local someipsrc port 51075 connected with somedestipiwanttospeedtest-censored port 80
[  4] local someipsrc port 58020 connected with somedestipiwanttospeedtest-censored port 80
[  3] local someipsrc port 50056 connected with somedestipiwanttospeedtest-censored port 80
[  7] local someipsrc port 57017 connected with somedestipiwanttospeedtest-censored port 80
[  8] local someipsrc port 49473 connected with somedestipiwanttospeedtest-censored port 80
[  9] local someipsrc port 50491 connected with somedestipiwanttospeedtest-censored port 80
[ 10] local someipsrc port 40974 connected with somedestipiwanttospeedtest-censored port 80
[ 11] local someipsrc port 38348 connected with somedestipiwanttospeedtest-censored port 80
[ ID] Interval       Transfer     Bandwidth
[ 12]  0.0-10.0 sec   114 MBytes  95.7 Mbits/sec
[ 12] Sent 81355 datagrams
[  5]  0.0-10.0 sec   114 MBytes  95.8 Mbits/sec
[  5] Sent 81448 datagrams
[  6]  0.0-10.0 sec   114 MBytes  95.8 Mbits/sec
[  6] Sent 81482 datagrams
[  4]  0.0-10.0 sec   114 MBytes  95.7 Mbits/sec
[  4] Sent 81349 datagrams
[  3]  0.0-10.0 sec   114 MBytes  95.7 Mbits/sec
[  3] Sent 81398 datagrams
[  7]  0.0-10.0 sec   114 MBytes  95.8 Mbits/sec
[  7] Sent 81443 datagrams
[  8]  0.0-10.0 sec   114 MBytes  95.7 Mbits/sec
[  8] Sent 81408 datagrams
[  9]  0.0-10.0 sec   114 MBytes  95.8 Mbits/sec
[  9] Sent 81421 datagrams
[ 10]  0.0-10.0 sec   114 MBytes  95.7 Mbits/sec
[ 10] Sent 81404 datagrams
[ 11]  0.0-10.0 sec   114 MBytes  95.8 Mbits/sec
[ 11] Sent 81427 datagrams
[SUM]  0.0-10.0 sec  1.11 GBytes   957 Mbits/sec


It looks like you are getting the bandwidth you desire, when repeating the test with 20 connections I can see the bandwidth hits a total of 2.01Gbits/sec

# iperf -c somedestipiwanttospeedtest-censored -p 80 -P 20 -b 100m
WARNING: option -b implies udp testing
------------------------------------------------------------
Client connecting to somedestipiwanttospeedtest-censored, UDP port 80
Sending 1470 byte datagrams
UDP buffer size:  208 KByte (default)
------------------------------------------------------------
[ 22] local someipsrc port 44231 connected with somedestipiwanttospeedtest-censored port 80
[  4] local someipsrc port 55259 connected with somedestipiwanttospeedtest-censored port 80
[  7] local someipsrc port 49519 connected with somedestipiwanttospeedtest-censored port 80
[  3] local someipsrc port 45301 connected with somedestipiwanttospeedtest-censored port 80
[  6] local someipsrc port 48654 connected with somedestipiwanttospeedtest-censored port 80
[  5] local someipsrc port 33666 connected with somedestipiwanttospeedtest-censored port 80
[  8] local someipsrc port 33963 connected with somedestipiwanttospeedtest-censored port 80
[  9] local someipsrc port 39593 connected with somedestipiwanttospeedtest-censored port 80
[ 10] local someipsrc port 36229 connected with somedestipiwanttospeedtest-censored port 80
[ 11] local someipsrc port 36331 connected with somedestipiwanttospeedtest-censored port 80
[ 14] local someipsrc port 54622 connected with somedestipiwanttospeedtest-censored port 80
[ 13] local someipsrc port 36159 connected with somedestipiwanttospeedtest-censored port 80
[ 12] local someipsrc port 53881 connected with somedestipiwanttospeedtest-censored port 80
[ 15] local someipsrc port 43221 connected with somedestipiwanttospeedtest-censored port 80
[ 16] local someipsrc port 60284 connected with somedestipiwanttospeedtest-censored port 80
[ 17] local someipsrc port 49735 connected with somedestipiwanttospeedtest-censored port 80
[ 18] local someipsrc port 43866 connected with somedestipiwanttospeedtest-censored port 80
[ 19] local someipsrc port 44631 connected with somedestipiwanttospeedtest-censored port 80
[ 20] local someipsrc port 56852 connected with somedestipiwanttospeedtest-censored port 80
[ 21] local someipsrc port 59338 connected with somedestipiwanttospeedtest-censored port 80
[ ID] Interval       Transfer     Bandwidth
[ 22]  0.0-10.0 sec   120 MBytes   101 Mbits/sec
[ 22] Sent 85471 datagrams
[  4]  0.0-10.0 sec   120 MBytes   101 Mbits/sec
[  4] Sent 85449 datagrams
[  7]  0.0-10.0 sec   120 MBytes   101 Mbits/sec
[  7] Sent 85448 datagrams
[  3]  0.0-10.0 sec   120 MBytes   101 Mbits/sec
[  3] Sent 85448 datagrams
[  6]  0.0-10.0 sec   120 MBytes   101 Mbits/sec
[  6] Sent 85449 datagrams
[  5]  0.0-10.0 sec   120 MBytes   101 Mbits/sec
[  5] Sent 85448 datagrams
[  8]  0.0-10.0 sec   120 MBytes   101 Mbits/sec
[  8] Sent 85453 datagrams
[  9]  0.0-10.0 sec   120 MBytes   101 Mbits/sec
[  9] Sent 85453 datagrams
[ 10]  0.0-10.0 sec   120 MBytes   101 Mbits/sec
[ 10] Sent 85454 datagrams
[ 11]  0.0-10.0 sec   120 MBytes   101 Mbits/sec
[ 11] Sent 85456 datagrams
[ 14]  0.0-10.0 sec   120 MBytes   101 Mbits/sec
[ 14] Sent 85457 datagrams
[ 13]  0.0-10.0 sec   120 MBytes   101 Mbits/sec
[ 13] Sent 85457 datagrams
[ 12]  0.0-10.0 sec   120 MBytes   101 Mbits/sec
[ 12] Sent 85457 datagrams
[ 15]  0.0-10.0 sec   120 MBytes   101 Mbits/sec
[ 15] Sent 85460 datagrams
[ 16]  0.0-10.0 sec   120 MBytes   101 Mbits/sec
[ 16] Sent 85461 datagrams
[ 17]  0.0-10.0 sec   120 MBytes   101 Mbits/sec
[ 17] Sent 85462 datagrams
[ 18]  0.0-10.0 sec   120 MBytes   101 Mbits/sec
[ 18] Sent 85464 datagrams
[ 19]  0.0-10.0 sec   120 MBytes   101 Mbits/sec
[ 19] Sent 85467 datagrams
[ 20]  0.0-10.0 sec   120 MBytes   101 Mbits/sec
[ 20] Sent 85467 datagrams
[ 21]  0.0-10.0 sec   120 MBytes   101 Mbits/sec
[ 21] Sent 85467 datagrams
[SUM]  0.0-10.0 sec  2.34 GBytes  2.01 Gbits/sec

The last test I did used 2 connections only at 500mbit each;

# iperf -c somedestipiwanttospeedtest-censored -p 80 -P 2 -b 500m
WARNING: option -b implies udp testing
------------------------------------------------------------
Client connecting to somedestipiwanttospeedtest-censored, UDP port 80
Sending 1470 byte datagrams
UDP buffer size:  208 KByte (default)
------------------------------------------------------------
[  4] local someipsrc port 60841 connected with somedestipiwanttospeedtest-censored port 80
[  3] local someipsrc port 51495 connected with somedestipiwanttospeedtest-censored port 80
[ ID] Interval       Transfer     Bandwidth
[  4]  0.0-10.0 sec   570 MBytes   479 Mbits/sec
[  4] Sent 406935 datagrams
[  3]  0.0-10.0 sec   570 MBytes   479 Mbits/sec
[  3] Sent 406933 datagrams
[SUM]  0.0-10.0 sec  1.11 GBytes   957 Mbits/sec
It’s possible for the customer to do this thru the API, but it is without express warantee. It’s not possible to resize performance servers thru the mycloud control panel, so, to do it you will need to use curl API, or what I like to use, supernova wrapper for nova or nova. It’s quite simple really;
The below example is how to resize a performance server to 4 gigs (this was from 2 gigs)
supernova customer resize --poll uuidgoeshere performance1-4
# read -p "Interface: " iface; ethtool -k $iface | awk -F: '/offload: on$/{print$1}' | sed 's/^\(.\).*-\(.\).*-\(.\).*/\1\2\3/' | xargs --no-run-if-empty -n1 -I{} ethtool -K $iface {} off


Disable offloading for all interfaces:

# for iface in $(cd /sys/class/net; echo *); do ethtool -k $iface | awk -F: '/offload: on$/{print$1}' | sed 's/^\(.\).*-\(.\).*-\(.\).*/\1\2\3/' | xargs --no-run-if-empty -n1 -I{} ethtool -K $iface {} off; done
A big thank you to Daniel C. for this!
So, today, a customer was asking if we could show speed tests to CDN.
So I used my french server to test external connections from outside of Rackspace. For a CDN, it’s fairly speedy!
#!/bin/bash
CSTATS=`curl -w '%{speed_download}\t%{time_namelookup}\t%{time_total}\n' -o /dev/null -s http://6281487ef0c74fc1485b-69e4500000000000dfasdcd1b6b.r12.cf1.rackcdn.com/bigfile-rackspace-testing`
SPEED=`echo $CSTATS | awk '{print $1}' | sed 's/\..*//'`
DNSTIME=`echo $CSTATS | awk '{print $2}'`
TOTALTIME=`echo $CSTATS | awk '{print $3}'`
echo "Transfered $SPEED bytes/sec in $TOTALTIME seconds."
echo "DNS Resolve Time was $DNSTIME seconds."
# ./speedtest.sh
Transfered 3991299 bytes/sec in 26.272 seconds.
DNS Resolve Time was 0.061 seconds.
root@ns310045:~# ./speedtest.sh
Transfered 7046221 bytes/sec in 14.881 seconds.
DNS Resolve Time was 0.004 seconds.
root@ns310045:~# ./speedtest.sh
Transfered 29586916 bytes/sec in 3.544 seconds.
DNS Resolve Time was 0.004 seconds.
root@ns310045:~# ./speedtest.sh
Transfered 14539272 bytes/sec in 7.212 seconds.
DNS Resolve Time was 0.004 seconds.
root@ns310045:~# ./speedtest.sh
Transfered 9060846 bytes/sec in 11.573 seconds.
DNS Resolve Time was 0.004 seconds.
root@ns310045:~# ./speedtest.sh
Transfered 25551753 bytes/sec in 4.104 seconds.
DNS Resolve Time was 0.004 seconds.
root@ns310045:~# ./speedtest.sh
Transfered 28225927 bytes/sec in 3.715 seconds.
DNS Resolve Time was 0.004 seconds.
root@ns310045:~# ./speedtest.sh
Transfered 9036412 bytes/sec in 11.604 seconds.
DNS Resolve Time was 0.004 seconds.
root@ns310045:~# ./speedtest.sh
Transfered 32328623 bytes/sec in 3.243 seconds.
DNS Resolve Time was 0.004 seconds.
So, what to do if a customer has a server which is frequently crashing? Well, important things to check is open files, to look at all the users in /etc/passwd and substitute the username to check each of their cron jobs and check the files which are open using the apache process id.
This will help rule out a lot of common issues being seen on servers, and may even be of use for checking whether the server has been hacked.
netstat -ntulp
for i in $(awk -F: '{print $1}' /etc/passwd); do crontab -l -u $i ;done
lsof -p $(cat /var/run/apache2/apache2.pid) | grep log
This is a nice one liner, thanks to my colleague Aaron for providing this, well, actually it was so awesome I stole it 😛
So, I was thinking about the Rackspace traceroute monitoring API and wondering what I could do with it, when I come across this gem
/monitoring_zones/mzsyd/traceroute
Well what is it you ask. Well it’s an API path for performing a traceroute on the 6 different region endpoints. This means you can use an API call to run traceroutes (for free!) thru the Rackspace cloud monitoring API. This would be pretty handy at testing connectivity around the world to your chosen destination from each datacentre. Handy Andy.
Then you ask what does the mzsyd mean? That’s a region ID: Let’s see about putting together a script to list the region ID’s we can run the traceroutes on first of all:
!/bin/bash

USERNAME='mycloudusername'
APIKEY='mycloudapikey'
ACCOUNTNUMBER='10010110'
API_ENDPOINT="https://monitoring.api.rackspacecloud.com/v1.0/$ACCOUNTNUMBER"


TOKEN=`curl https://identity.api.rackspacecloud.com/v2.0/tokens -X POST -d '{ "auth":{"RAX-KSKEY:apiKeyCredentials": { "username":"'$USERNAME'", "apiKey": "'$APIKEY'" }} }' -H "Content-type: application/json" |  python -mjson.tool | grep -A5 token | grep id | cut -d '"' -f4`


curl -s -v  \
-H "X-Auth-Token: $TOKEN"  \
-H "X-Project-Id: $ACCOUNTNUMBER" \
-H "Accept: application/json"  \
-X GET  \
"$API_ENDPOINT/monitoring_zones"
Lets take a look at the response when I run this monitoring zone list.
chmod +x list-monitoring-zones.sh
./list-monitoring-zones.sh
< Content-Type: application/json; charset=UTF-8
< Via: 1.1 Repose (Repose/7.3.0.0)
< Vary: Accept-Encoding
< X-LB: api1.dfw1.prod.cm.k1k.me
< Transfer-Encoding: chunked
<
{
    "values": [
        {
            "id": "mzdfw",
            "label": "Dallas Fort Worth (DFW)",
            "country_code": "US",
            "source_ips": [
                "2001:4800:7902:0001::/64",
                "50.56.142.128/26"
            ]
        },
        {
            "id": "mzhkg",
            "label": "Hong Kong (HKG)",
            "country_code": "HK",
            "source_ips": [
                "2401:1800:7902:0001::/64",
                "180.150.149.64/26"
            ]
        },
        {
            "id": "mziad",
            "label": "Northern Virginia (IAD)",
            "country_code": "US",
            "source_ips": [
                "2001:4802:7902:0001::/64",
                "69.20.52.192/26"
            ]
        },
        {
            "id": "mzlon",
            "label": "London (LON)",
            "country_code": "GB",
            "source_ips": [
                "2a00:1a48:7902:0001::/64",
                "78.136.44.0/26"
            ]
        },
        {
            "id": "mzord",
            "label": "Chicago (ORD)",
            "country_code": "US",
            "source_ips": [
                "2001:4801:7902:0001::/64",
                "50.57.61.0/26"
            ]
        },
        {
            "id": "mzsyd",
            "label": "Sydney (SYD)",
            "country_code": "AU",
            "source_ips": [
                "2401:1801:7902:0001::/64",
                "119.9.5.0/26"
            ]
        }
    ],
    "metadata": {
        "count": 6,
        "limit": 100,
        "marker": null,
        "next_marker": null,
        "next_href": null
    }
* Connection #0 to host monitoring.api.rackspacecloud.com left intact
We can see many zones available to run our traceroute to;
id 'mzsyd' for Sydney SYD.
id 'mzdfw' for Dallas Fort Worth DFW
id 'mzhkg' for Hong Kong HKG
id 'mziad' for Northern Viginia IAD
id 'mzord' for Chicago ORD
id 'mzlon' for London LON
So now I know what the zone id's are, as defined above here. Now time to use them and run a traceroute to haxed.me.uk. Lets see;
!/bin/bash

USERNAME='mycloudusernamehere'
APIKEY='apikeyhere'
ACCOUNTNUMBER=10010110
API_ENDPOINT="https://monitoring.api.rackspacecloud.com/v1.0/$ACCOUNTNUMBER"


TOKEN=`curl https://identity.api.rackspacecloud.com/v2.0/tokens -X POST -d '{ "auth":{"RAX-KSKEY:apiKeyCredentials": { "username":"'$USERNAME'", "apiKey": "'$APIKEY'" }} }' -H "Content-type: application/json" |  python -mjson.tool | grep -A5 token | grep id | cut -d '"' -f4`


curl -s -v  \
-H "X-Auth-Token: $TOKEN"  \
-H "X-Project-Id: $ACCOUNTNUMBER" \
-H "Accept: application/json"  \
-d @ip.json -H "content-type: application/json" -X POST  \
"$API_ENDPOINT/monitoring_zones/mzsyd/traceroute"
You also need the ip.json file. It's easy to make, put it in the same dir as the shellscript.
{
        "target":               "haxed.me.uk",
        "target_resolver":      "IPv4"
}
We're going to refer to ip.json file which contains our destination data. You can do this with IPv6 IP's too if you wanted! That is pretty cool!
It is possible to do this without including the file, and actually just pass the json directly, with -d { "target": "haxed.me.uk", "target_resolver": "IPv4"} , but lets do it properly 😀
chmod +x perform-traceroute-from-monitoring-zone.sh
./perform-traceroute-from-monitoring-zone
the response, a nice traceroute of course from syd to my lon server.
 Accept: application/json
> content-type: application/json
> Content-Length: 55
>
* upload completely sent off: 55 out of 55 bytes
< HTTP/1.1 200 OK
< Date: Wed, 13 Jan 2016 11:19:14 GMT
< Server: Jetty(9.2.z-SNAPSHOT)
< X-RateLimit-Type: traceroute
< X-RateLimit-Remaining: 296
< X-RateLimit-Window: 24 hours
< x-trans-id: eyJyZXF1ZXN0SWQiOiI5MTNhNTY1Mi05ODAyLTQ5MmQtOTAwYS05NDU1M2ZhNDJmNzUiLCJvcmlnaW4
< X-RateLimit-Limit: 300
< X-Response-Id: .rh-TI8E.h-api1.ord1.prod.cm.k1k.me.r-4RFTh9up.c-28452540.ts-1452683954386.v-91eaf0a
< Content-Type: application/json; charset=UTF-8
< Via: 1.1 Repose (Repose/7.3.0.0)
< Vary: Accept-Encoding
< X-LB: api0.ord1.prod.cm.k1k.me
< Transfer-Encoding: chunked
<
{
    "result": [
        {
            "ip": "119.9.5.2",
            "hostname": null,
            "number": 1,
            "rtts": [
                0.421,
                0.384,
                0.442,
                0.457,
                0.455
            ]
        },
        {
            "ip": "119.9.0.30",
            "hostname": null,
            "number": 2,
            "rtts": [
                1.015,
                0.872,
                0.817,
                1.014,
                0.926
            ]
        },
        {
            "ip": "119.9.0.109",
            "hostname": null,
            "number": 3,
            "rtts": [
                1.203,
                1.179,
                1.185,
                1.232,
                1.182
            ]
        },
        {
            "ip": "202.84.223.2",
            "hostname": null,
            "number": 4,
            "rtts": [
                3.53,
                5.301,
                3.975,
                5.772,
                3.804
            ]
        },
        {
            "ip": "202.84.223.1",
            "hostname": null,
            "number": 5,
            "rtts": [
                3.437,
                3.522,
                2.837,
                4.274,
                2.805
            ]
        },
        {
            "ip": "202.84.140.206",
            "hostname": null,
            "number": 6,
            "rtts": [
                141.198,
                140.746,
                143.871,
                140.987,
                141.545
            ]
        },
        {
            "ip": "202.40.149.238",
            "hostname": null,
            "number": 7,
            "rtts": [
                254.354,
                175.559,
                176.787,
                176.701,
                175.634
            ]
        },
        {
            "ip": "134.159.63.18",
            "hostname": null,
            "number": 8,
            "rtts": [
                175.302,
                175.299,
                175.183,
                175.146,
                175.149
            ]
        },
        {
            "ip": "64.125.26.6",
            "hostname": null,
            "number": 9,
            "rtts": [
                175.395,
                175.408,
                175.469,
                175.49,
                175.475
            ]
        },
        {
            "ip": "64.125.30.184",
            "hostname": null,
            "number": 10,
            "rtts": [
                285.818,
                285.872,
                285.801,
                285.835,
                285.887
            ]
        },
        {
            "ip": "64.125.29.52",
            "hostname": null,
            "number": 11,
            "rtts": [
                285.864,
                285.938,
                285.826,
                285.922,
                303.125
            ]
        },
        {
            "ip": "64.125.28.98",
            "hostname": null,
            "number": 12,
            "rtts": [
                284.711,
                284.865,
                284.73,
                284.697,
                284.713
            ]
        },
        {
            "ip": "64.125.29.48",
            "hostname": null,
            "number": 13,
            "rtts": [
                287.341,
                310.82,
                287.33,
                287.359,
                287.455
            ]
        },
        {
            "ip": "64.125.29.130",
            "hostname": null,
            "number": 14,
            "rtts": [
                286.168,
                286.012,
                286.108,
                286.105,
                286.168
            ]
        },
        {
            "ip": "64.125.30.235",
            "hostname": null,
            "number": 15,
            "rtts": [
                284.61,
                284.681,
                284.667,
                284.892,
                286.069
            ]
        },
        {
            "ip": "64.125.20.97",
            "hostname": null,
            "number": 16,
            "rtts": [
                287.516,
                287.435,
                287.557,
                287.581,
                287.438
            ]
        },
        {
            "ip": "94.31.42.254",
            "hostname": null,
            "number": 17,
            "rtts": [
                288.156,
                288.019,
                288.034,
                288.08
            ]
        },
        {
            "ip": null,
            "hostname": null,
            "number": 18,
            "rtts": []
        },
        {
            "ip": "134.213.131.251",
            "hostname": null,
            "number": 19,
            "rtts": [
                292.687,
                293.72,
                295.335,
                293.981
            ]
        },
        {
            "ip": "162.13.232.1",
            "hostname": null,
            "number": 20,
            "rtts": [
                293.295,
                293.738,
                295.46,
                294.301
            ]
        },
        {
            "ip": "162.13.232.103",
            "hostname": null,
            "number": 21,
            "rtts": [
                294.733,
                294.996,
                298.884,
                295.056
            ]
        },
        {
            "ip": "162.13.136.211",
            "hostname": null,
            "number": 22,
            "rtts": [
                294.919,
                294.77,
                298.956,
                296.481
            ]
        }
    ]
* Connection #0 to host monitoring.api.rackspacecloud.com left intact
This is pretty cool. If we want to run a traceroute from lets say chicago, we just swap out the 'mzsyd' variable to show 'mziad', wow thats simple :)